
Investigating IDS logs with Elasticstack: TryHackMe ItsyBitsy
Recently I’ve been learning to use Kibana as part of the Elasticstack (formerly the ELK stack), frequently used for data visualization and analysis. It’s particularly popular in information security as a fast way to correlate network events in the face of what would otherwise be an overwhelming amount of log data.
TryHackMe offers a challenge called “ItsyBitsy” that requires investigation of HTTP connection logs in Kibana. In this blog, I’ll provide a walkthrough of that challenge, located here: https://tryhackme.com/room/itsybitsy
In the simulated environment, C2 beaconing was identified on the network, and it is our job to find the flag, or winning phrase, stored in the malicious payload. On our way to that goal, the TryHackMe room poses other questions for which I will explain the answers.
Events of March 2022
The first question in this room asks “How many events were returned for the month of March 2022?“
To find the answer, we simply filter the time range to the month of March 2022 as such:
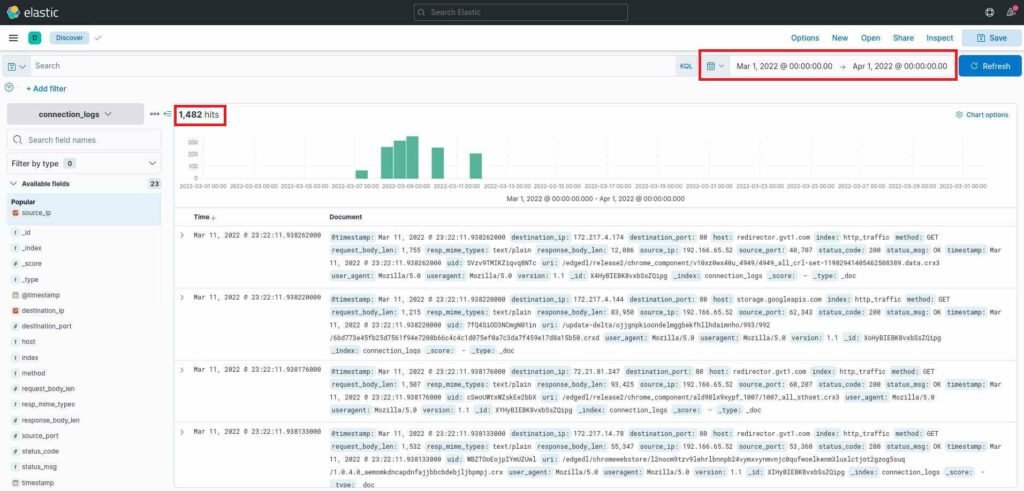
Notice I’ve highlighted where to adjust the timeframe in the Kibana interface. I’ve also highlighted the answer to the first question, 1,482 hits.
Suspicious IP address
The second question we must answer is “What is the IP associated with the suspected user in the logs?“
To find the IP addresses present in the log, we must examine available fields in Kibana. In the Fields pane on the left, we have many fields by which we can filter the presented data. In this case, we care about the IP address, so we’ll use a field pertaining to that. However, how do we know whether to use the “source_ip” field or the “destination_ip” field?
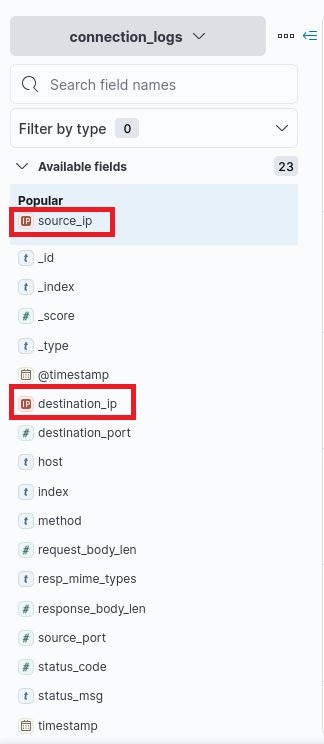
To uncover the answer, consider the kind of malicious connection for which we’re searching, then consider the flow of network traffic relative to that connection. We know that we’re searching for a malicious payload pulled into the network through a C2 channel. For the payload to be transmitted via HTTP, it must first be requested. The request would have details about the malicious file requested and the compromised system on our network that originated the request. Therefore, we’re looking for the requester, otherwise known as the source of the request. For that reason, we’ll use the “source_ip” field.
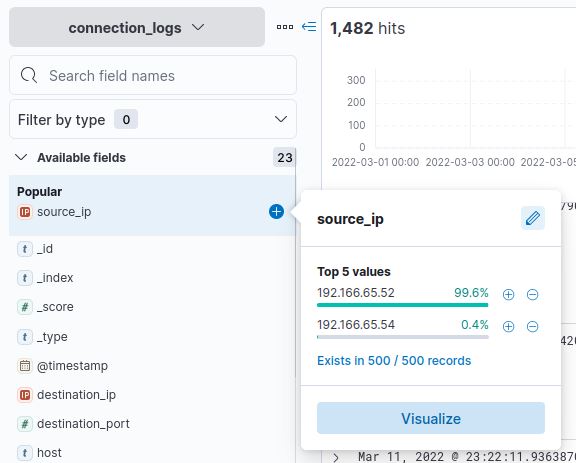
Selecting source_ip reveals that there are only two IP addresses to examine. The first, 192.166.65.52, accounts for 99.6% of traffic, while the second, 192.166.65.54, accounts for only 0.4%. At first glance, you may think that a C2 beacon regularly pings the C2 server, resulting in more than 2 HTTP connections, but closer inspection reveals that doesn’t seem to be the case.
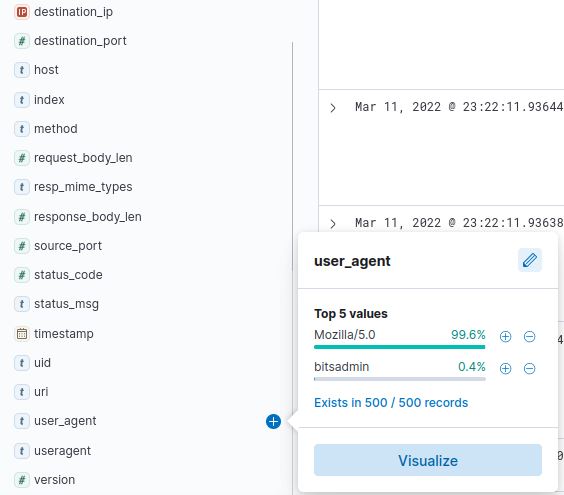
I determined this by examining the user_agent field. The user_agent can be spoofed, but in less sophisticated attacks, it could be a clear indication of suspicious activity. In this case, 0.4% of traffic has the user_agent “bitsadmin”, a legitimate Windows tool used to queue upload and download jobs. This tool is perfect for transmitting a payload, so it warrants further investigation. I’ll click on the “+” button next to bitsadmin to filter only those connections.
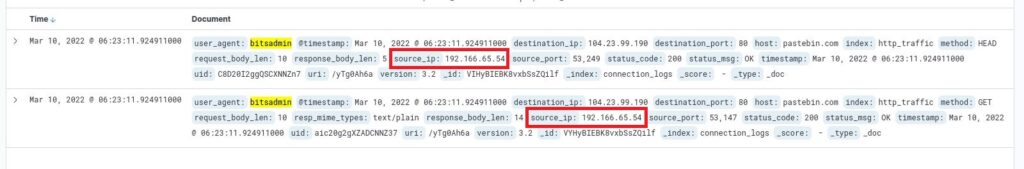
Here we can clearly see that the source_ip 192.166.65.54, responsible for 0.4% of traffic, is also using bitsadmin, which was also responsible for 0.4% of traffic. That’s enough for me to conclude we have identified the suspicious IP.
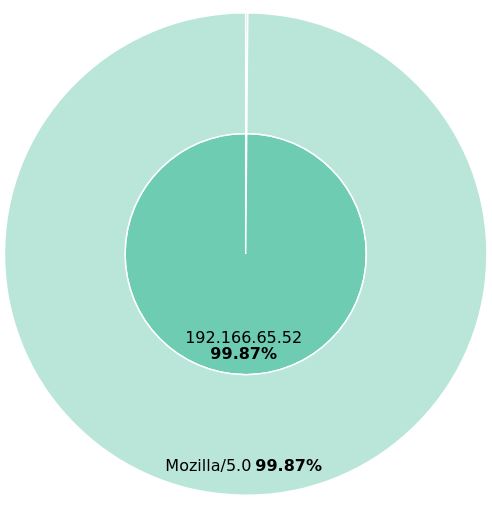
This can be further confirmed through the use of Kibana’s robust visualization tools. In the graph below, note that the outer and inner circles line up. The tiny sliver of light blue indicate that the same requests with user_agent bitsadmin are also originating from 192.166.65.54.
Legitimate binary
The next question in the TryHackMe room is “The user’s machine used a legit windows binary to download a file from the C2 server. What is the name of the binary?“
The answer to this question is easy, since we already used the name of the software in the user_agent to track down the suspicious IP. It’s bitsadmin.
Filesharing C2
The next question is “The infected machine connected with a famous filesharing site in this period, which also acts as a C2 server used by the malware authors to communicate. What is the name of the filesharing site?“
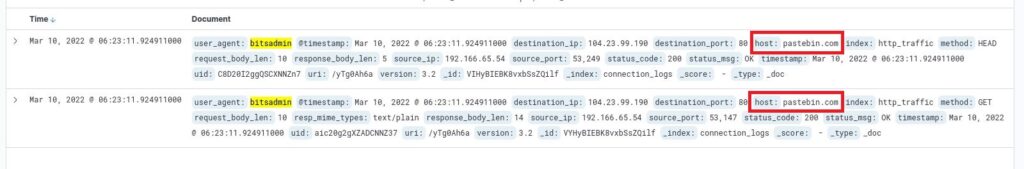
The host fields in the two filtered logs reveal the answer. pastebin.com
Full URL
“What is the full URL of the C2 to which the infected host is connected?“
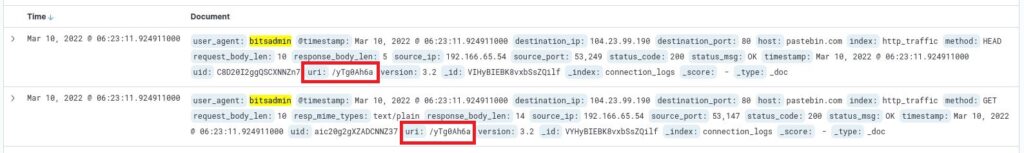
By combining the URI in the logs with the domain name identified in the previous question, we arrive at a full URL. pastebin.com/yTg0Ah6a
Technically, URLs should have a protocol in front of them (i.e. https://) to be considered URLs, but the terms are so interchangeable in common conversation that it’s not a necessary distinction. If you’d like to learn more about the difference, see this guide.
Secret file
“A file was accessed on the filesharing site. What is the name of the file accessed?“
There’s no indication in an HTTP log the name of the file, but we do have clue to the file extension. In the GET request, the field “resp_mime_types” has the value “text/plain”. This tells us we’re looking for a .txt file.
To find the filename, we have to poke at the C2 a little bit more. Fortunately for us, it’s hosted on a public website, so we can just visit it using a browser.
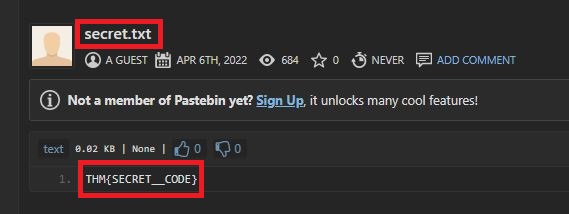
There it is! The name of the file is secret.txt.
We can see in the contents of the file that we’ve discovered the final flag too. THM{SECRET__CODE}. If this were a real attack, this is where we would find the malicious payload.